The optimization of sheet metal forming processes, considering the right 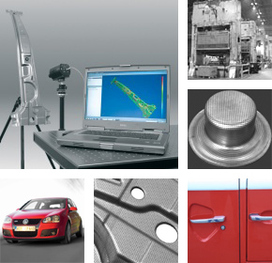 material choice and tool optimization, is a decisive factor for competitiveness, particularly in the automotive industry.
The optical 3D forming analysis system ARGUS supports such optimization processes with precise results of the forming distribution of components.
The results from the ARGUS system provide full-field information about:
- 3D coordinates of the component’s surface
- Form change (major and minor strain)
- Thickness reduction
- Forming Limit Diagram (FLD)
All results are presented in a fine resolution mesh created from the determination of the 3D coordinates and reflecting the surface of the measured object.
In the Forming Limit Diagram the measurement results are compared to the material characteristics of the blank (Forming Limit Curve) to determine critical forming areas.
The measuring system operates independent of the forming process and provides full-field results with high local resolution, for small as well as for large components.
It is used to analyze components made from flat blanks, tubes or other components manufactured by an internal high pressure forming process (IHPF).
The optical forming analysis using ARGUS has become a proven tool for evaluating forming processes. The unique possibility to measure complex sheet metal parts with a high scanning density opens up new aspects for the verification of forming simulations.
The optimization of sheet metal forming processes, considering the right material choice and tool optimization, is a decisive factor for competitiveness, particularly in the automotive industry.
The optical 3D forming analysis system ARGUS supports such optimization processes with precise results of the forming distribution of components.
The results from the ARGUS system provide full-field information about:
- 3D coordinates of the component’s surface
- Form change (major and minor strain)
- Thickness reduction
- Forming Limit Diagram (FLD)
All results are presented in a fine resolution mesh created from the determination of the 3D coordinates and reflecting the surface of the measured object.
In the Forming Limit Diagram the measurement results are compared to the material characteristics of the blank (Forming Limit Curve) to determine critical forming areas.
The measuring system operates independent of the forming process and provides full-field results with high local resolution, for small as well as for large components.
It is used to analyze components made from flat blanks, tubes or other components manufactured by an internal high pressure forming process (IHPF).
The optical forming analysis using ARGUS has become a proven tool for evaluating forming processes. The unique possibility to measure complex sheet metal parts with a high scanning density opens up new aspects for the verification of forming simulations.
ARGUS is the solution for…
- Detection of critical deformation areas
- Solving complex forming problems
- Optimization of forming processes
- Verification of tools
- Verification and optimization of numerical simulations
Verification of FE simulations
As part of complex process chains, optical measuring systems have become important tools in industrial sheet metal forming processes in the last years. Together with the numerical simulation of forming they have significant potential for quality improvement and optimization of development time for products and production.
ARGUS strongly supports the verification of FE-simulations.
The import of FE result datasets allows to perform numerical full-field comparisons to FE simulations for sheet metal parts.
Thus finite element simulations can be optimized and are getting more reliable.